ETH daily chart shows double bottom pattern, signaling potential recovery to $3,900
January 06, 2026, 7:14 PM
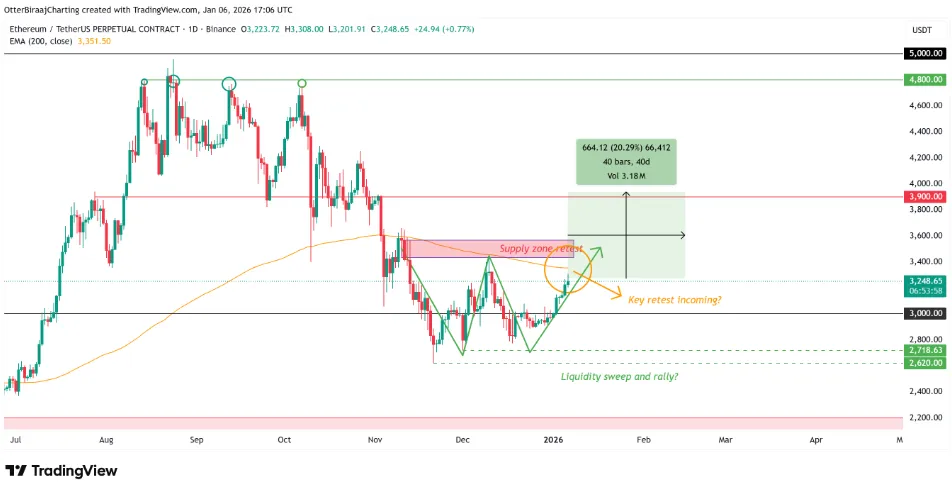 A double bottom pattern is forming on the Ethereum (ETH) daily chart, which could signal a recovery to the $3,900 level if completed, according to an analysis by Cointelegraph. The media outlet noted that the pattern has been developing since the fourth quarter of last year, suggesting that demand at a key support zone has successfully defended the level on multiple occasions. A completion of this pattern would set a target price of $3,900, approximately 20% above its current price.
The key hurdle for this bullish scenario is reclaiming the 200-day exponential moving average (EMA). Cointelegraph explained that since turning bearish in November of last year, ETH has failed in two attempts to rise above the 200-day EMA, with each rejection leading to a continued downtrend. Consequently, a daily candle closing above the 200-day EMA could enable a breakout above the long-term trend resistance line.
A double bottom pattern is forming on the Ethereum (ETH) daily chart, which could signal a recovery to the $3,900 level if completed, according to an analysis by Cointelegraph. The media outlet noted that the pattern has been developing since the fourth quarter of last year, suggesting that demand at a key support zone has successfully defended the level on multiple occasions. A completion of this pattern would set a target price of $3,900, approximately 20% above its current price.
The key hurdle for this bullish scenario is reclaiming the 200-day exponential moving average (EMA). Cointelegraph explained that since turning bearish in November of last year, ETH has failed in two attempts to rise above the 200-day EMA, with each rejection leading to a continued downtrend. Consequently, a daily candle closing above the 200-day EMA could enable a breakout above the long-term trend resistance line.Log in to leave comments!
Share insights, connect ideas
Log In