Spot CVD chart for April 2, 10:00 a.m. UTC
April 02, 2026, 10:06 AM
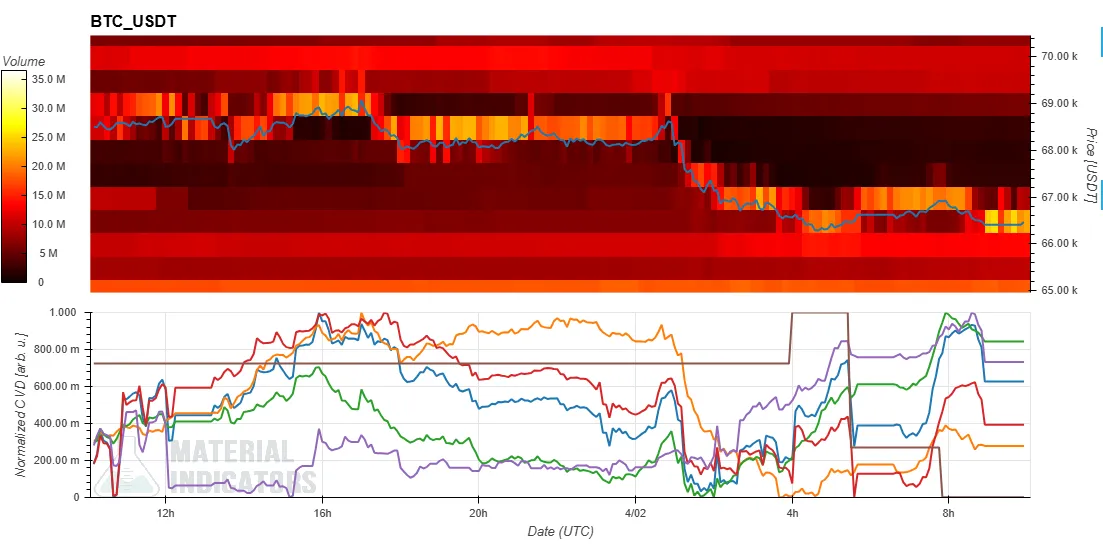 The Spot CVD chart analyzes the order book for the BTC/USDT spot trading pair. The top section displays a Volume Heatmap, while the bottom shows the Cumulative Volume Delta (CVD).
- The Volume Heatmap at the top tracks trading volume at specific price levels. The background color brightens in areas where the price consolidates or experiences significant movement, indicating potential support and resistance zones.
- The Cumulative Volume Delta (CVD) at the bottom illustrates buy and sell orders categorized by trade size. A rise in a colored line indicates an increase in buy orders within that category. For example, the yellow line represents orders between $100 and $1,000, while the brown line tracks large orders between $1 million and $10 million.
The Spot CVD chart analyzes the order book for the BTC/USDT spot trading pair. The top section displays a Volume Heatmap, while the bottom shows the Cumulative Volume Delta (CVD).
- The Volume Heatmap at the top tracks trading volume at specific price levels. The background color brightens in areas where the price consolidates or experiences significant movement, indicating potential support and resistance zones.
- The Cumulative Volume Delta (CVD) at the bottom illustrates buy and sell orders categorized by trade size. A rise in a colored line indicates an increase in buy orders within that category. For example, the yellow line represents orders between $100 and $1,000, while the brown line tracks large orders between $1 million and $10 million.Log in to leave comments!
Share insights, connect ideas
Log In