BTC spot CVD chart: 4 p.m. UTC, April 8
April 08, 2026, 4:07 PM
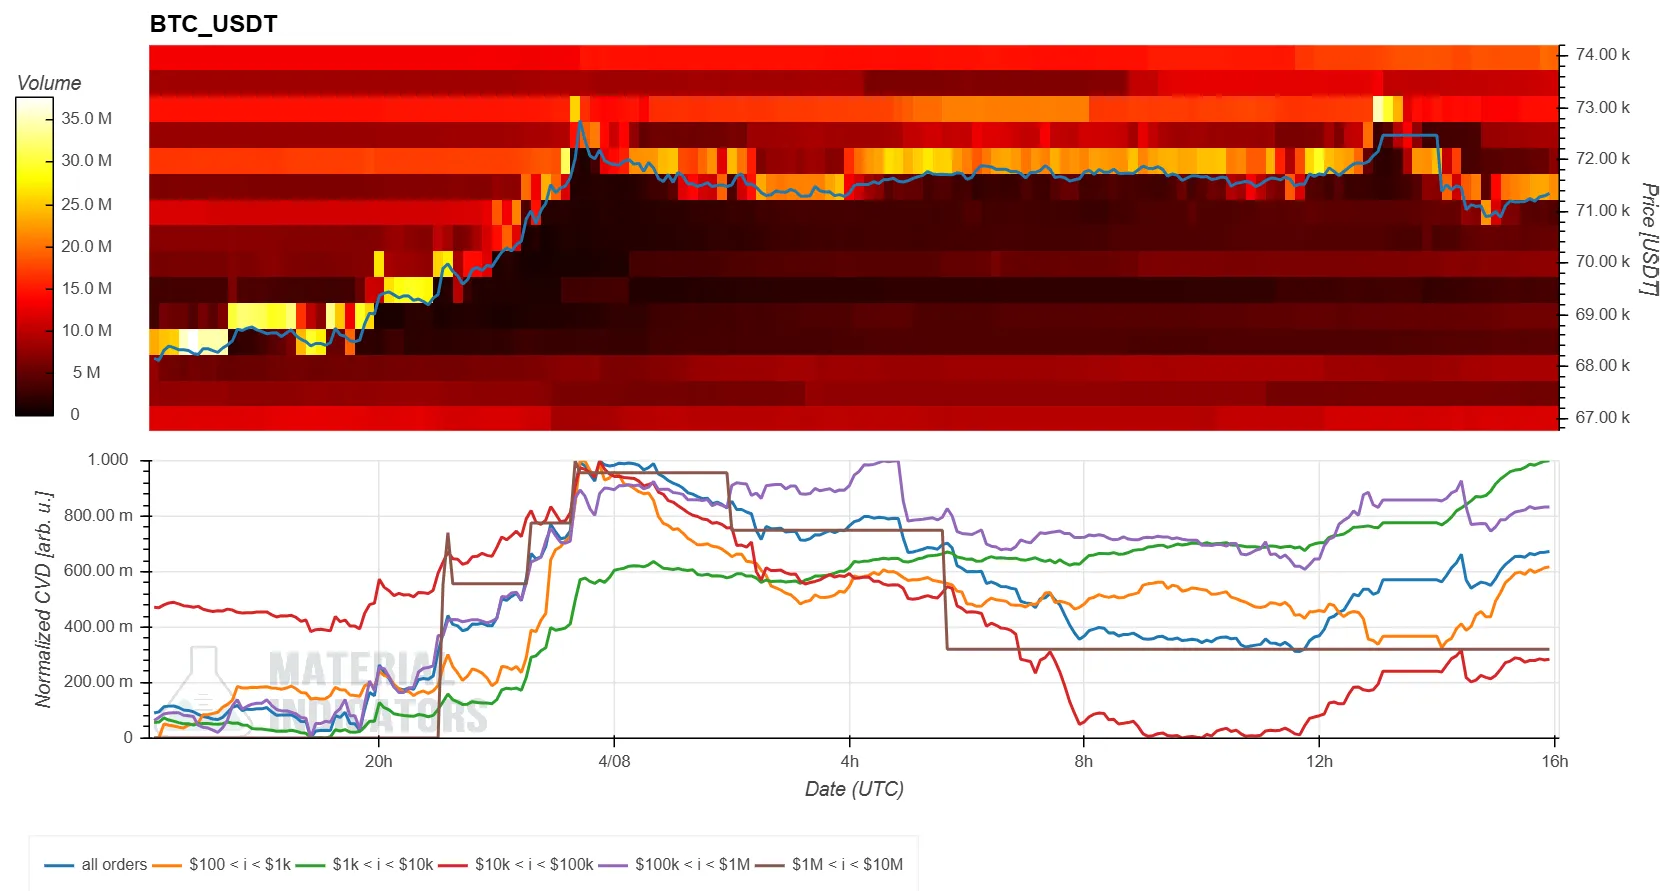 The following is an analysis of the Spot Cumulative Volume Delta (CVD) chart for the BTC/USDT spot pair. The top section shows the Volume Heatmap, and the bottom displays the CVD.
- The Volume Heatmap at the top tracks trading volume at specific price levels. The background color becomes brighter when the price lingers in a certain range or makes a significant move. These brighter areas can potentially act as support or resistance.
- The Cumulative Volume Delta (CVD) indicator at the bottom represents buy and sell orders categorized by size, with a rising line indicating an increase in buy orders. The yellow line represents orders from $100 to $1,000, while the brown line represents large orders from $1 million to $10 million.
The following is an analysis of the Spot Cumulative Volume Delta (CVD) chart for the BTC/USDT spot pair. The top section shows the Volume Heatmap, and the bottom displays the CVD.
- The Volume Heatmap at the top tracks trading volume at specific price levels. The background color becomes brighter when the price lingers in a certain range or makes a significant move. These brighter areas can potentially act as support or resistance.
- The Cumulative Volume Delta (CVD) indicator at the bottom represents buy and sell orders categorized by size, with a rising line indicating an increase in buy orders. The yellow line represents orders from $100 to $1,000, while the brown line represents large orders from $1 million to $10 million.Log in to leave comments!
Share insights, connect ideas
Log In