BTC spot CVD chart: April 24, 10 a.m. UTC
April 24, 2026, 10:08 AM
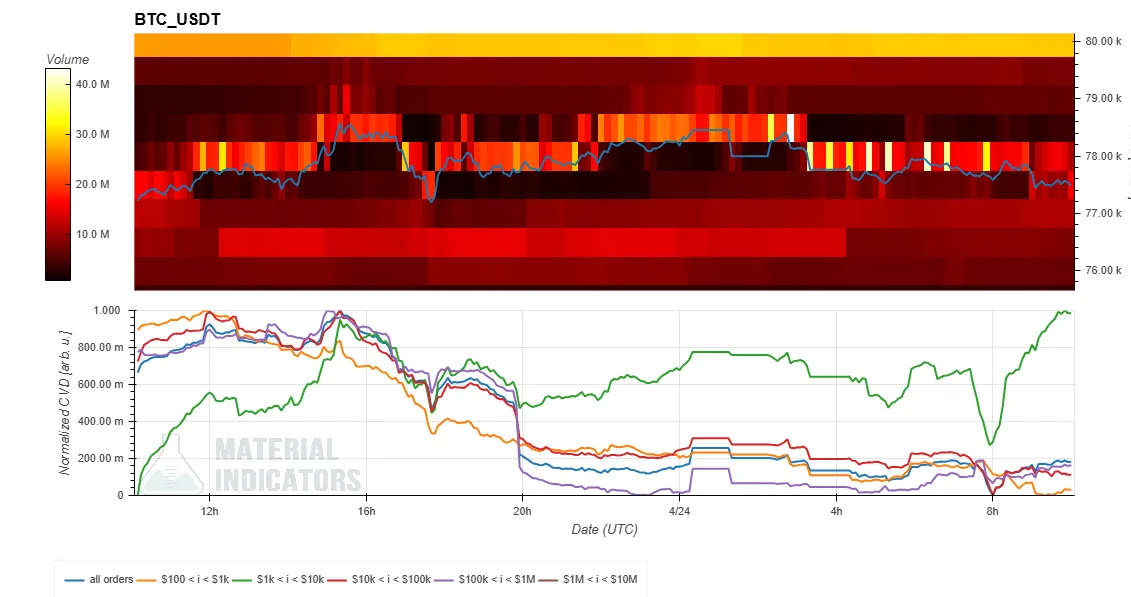 The Spot Cumulative Volume Delta (CVD) chart analyzes the order book for the BTC/USDT spot pair. The top section shows the Volume Heatmap, and the bottom displays the CVD.
- The Volume Heatmap at the top tracks trading volume at specific price levels. The background color brightens when the price remains in a certain range or moves significantly. These brighter areas can indicate potential support and resistance levels.
- The CVD indicator at the bottom represents buy and sell orders categorized by their monetary value. As buy orders for a specific category increase, the corresponding colored line rises.
- Yellow line: Orders between $100 and $1,000.
- Brown line: Large-scale orders between $1 million and $10 million.
The Spot Cumulative Volume Delta (CVD) chart analyzes the order book for the BTC/USDT spot pair. The top section shows the Volume Heatmap, and the bottom displays the CVD.
- The Volume Heatmap at the top tracks trading volume at specific price levels. The background color brightens when the price remains in a certain range or moves significantly. These brighter areas can indicate potential support and resistance levels.
- The CVD indicator at the bottom represents buy and sell orders categorized by their monetary value. As buy orders for a specific category increase, the corresponding colored line rises.
- Yellow line: Orders between $100 and $1,000.
- Brown line: Large-scale orders between $1 million and $10 million.Log in to leave comments!
Share insights, connect ideas
Log In