BTC spot CVD chart as of 11:00 a.m. UTC on May 7
May 07, 2026, 11:15 AM
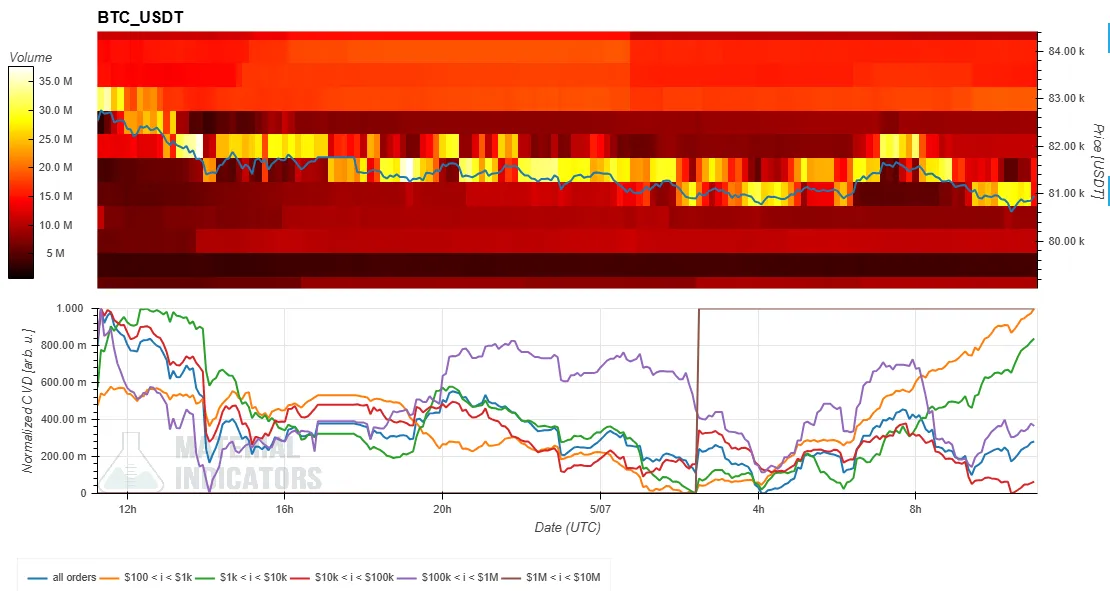 The Spot Cumulative Volume Delta (CVD) chart analyzes the order book for the BTC/USDT spot pair, comprising a Volume Heatmap on top and the CVD indicator below.
- The Volume Heatmap tracks trading volume at specific price levels. Brighter background colors indicate areas where the price has consolidated or moved significantly, which can potentially act as support or resistance.
- The CVD indicator represents buy and sell orders categorized by size. As buy orders increase, the corresponding colored line rises. For instance, the yellow line tracks orders between $100 and $1,000, while the brown line follows large orders between $1 million and $10 million.
The Spot Cumulative Volume Delta (CVD) chart analyzes the order book for the BTC/USDT spot pair, comprising a Volume Heatmap on top and the CVD indicator below.
- The Volume Heatmap tracks trading volume at specific price levels. Brighter background colors indicate areas where the price has consolidated or moved significantly, which can potentially act as support or resistance.
- The CVD indicator represents buy and sell orders categorized by size. As buy orders increase, the corresponding colored line rises. For instance, the yellow line tracks orders between $100 and $1,000, while the brown line follows large orders between $1 million and $10 million.Log in to leave comments!
Share insights, connect ideas
Log In