BTC/USDT spot CVD chart as of 12:00 a.m. UTC
May 08, 2026, 12:05 AM
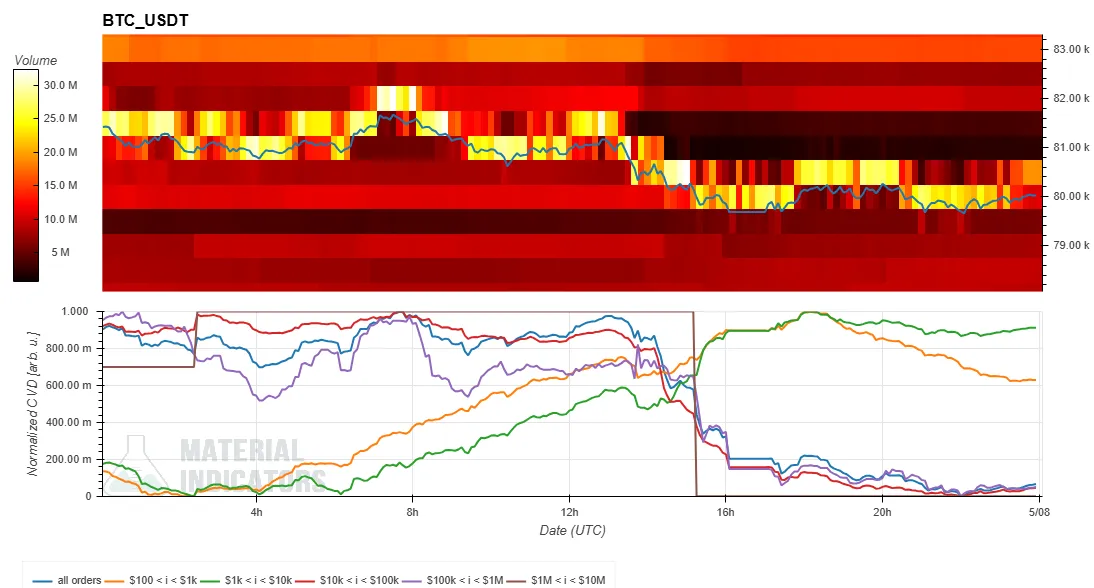 This is an order book analysis chart for the BTC/USDT spot pair, showing the Volume Heatmap in the top section and the Cumulative Volume Delta (CVD) in the bottom section.
- The top Volume Heatmap tracks the volume of trades at specific price levels. The background color becomes brighter when the price lingers in a certain range or moves significantly. Areas with brighter colors may act as support or resistance levels.
- The bottom Cumulative Volume Delta (CVD) indicator represents buy and sell orders categorized by trade size. As buy orders increase, the corresponding colored line rises. The yellow line tracks orders between $100 and $1,000, while the brown line tracks large orders between $1 million and $10 million.
This is an order book analysis chart for the BTC/USDT spot pair, showing the Volume Heatmap in the top section and the Cumulative Volume Delta (CVD) in the bottom section.
- The top Volume Heatmap tracks the volume of trades at specific price levels. The background color becomes brighter when the price lingers in a certain range or moves significantly. Areas with brighter colors may act as support or resistance levels.
- The bottom Cumulative Volume Delta (CVD) indicator represents buy and sell orders categorized by trade size. As buy orders increase, the corresponding colored line rises. The yellow line tracks orders between $100 and $1,000, while the brown line tracks large orders between $1 million and $10 million.Log in to leave comments!
Share insights, connect ideas
Log In