BTC/USDT spot CVD chart analysis for May 13
May 13, 2026, 12:04 AM
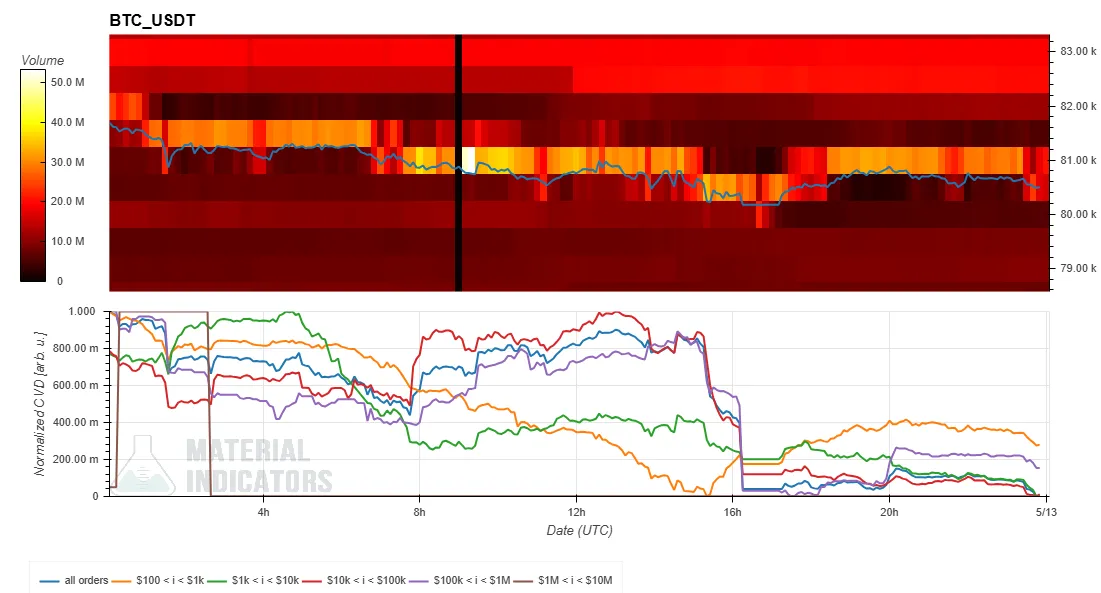 The following is an analysis of the BTC/USDT spot pair order book using the Spot Cumulative Volume Delta (CVD) chart. The top section shows a volume heatmap, while the bottom displays the CVD.
- The volume heatmap at the top tracks trading volume at specific price levels. The background color brightens when the price consolidates or moves significantly, with these brighter areas indicating potential support and resistance.
- The Cumulative Volume Delta (CVD) indicator at the bottom shows buy and sell orders categorized by size. A rising line indicates an increase in buy orders for that category. For example, the yellow line tracks orders between $100 and $1,000, while the brown line tracks large orders between $1 million and $10 million.
The following is an analysis of the BTC/USDT spot pair order book using the Spot Cumulative Volume Delta (CVD) chart. The top section shows a volume heatmap, while the bottom displays the CVD.
- The volume heatmap at the top tracks trading volume at specific price levels. The background color brightens when the price consolidates or moves significantly, with these brighter areas indicating potential support and resistance.
- The Cumulative Volume Delta (CVD) indicator at the bottom shows buy and sell orders categorized by size. A rising line indicates an increase in buy orders for that category. For example, the yellow line tracks orders between $100 and $1,000, while the brown line tracks large orders between $1 million and $10 million.Log in to leave comments!
Share insights, connect ideas
Log In