BTC spot CVD chart at 9:00 a.m. UTC on Oct. 3
October 03, 2026, 12:01 AM
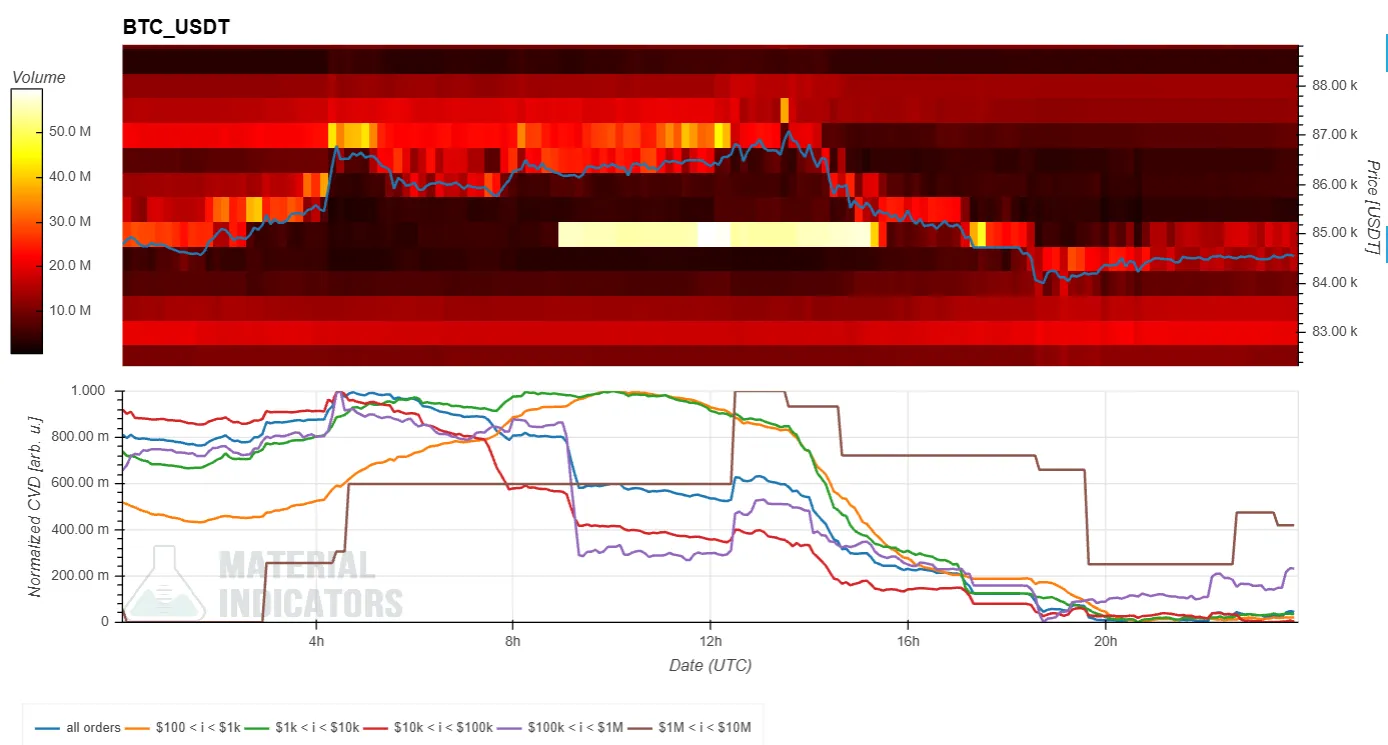 The spot CVD chart is an order-book analysis chart for the BTC/USDT spot pair. The upper section shows the volume heatmap, while the lower section shows cumulative volume delta, or CVD.
- The volume heatmap tracks trading volume at each price level. The background color becomes brighter when the price stays in a specific range for an extended period or moves sharply. Brighter zones may act as support or resistance.
- The CVD indicator shows buy and sell orders by order size. As buy orders increase, the corresponding colored line rises. The yellow line is based on orders worth $100 to $1,000, while the brown line reflects large orders worth $1 million to $10 million.
The spot CVD chart is an order-book analysis chart for the BTC/USDT spot pair. The upper section shows the volume heatmap, while the lower section shows cumulative volume delta, or CVD.
- The volume heatmap tracks trading volume at each price level. The background color becomes brighter when the price stays in a specific range for an extended period or moves sharply. Brighter zones may act as support or resistance.
- The CVD indicator shows buy and sell orders by order size. As buy orders increase, the corresponding colored line rises. The yellow line is based on orders worth $100 to $1,000, while the brown line reflects large orders worth $1 million to $10 million.Leave the first comment
You need to log in to leave a comment.
Log In