BTC spot CVD chart analysis for April 3
April 03, 2026, 10:08 AM
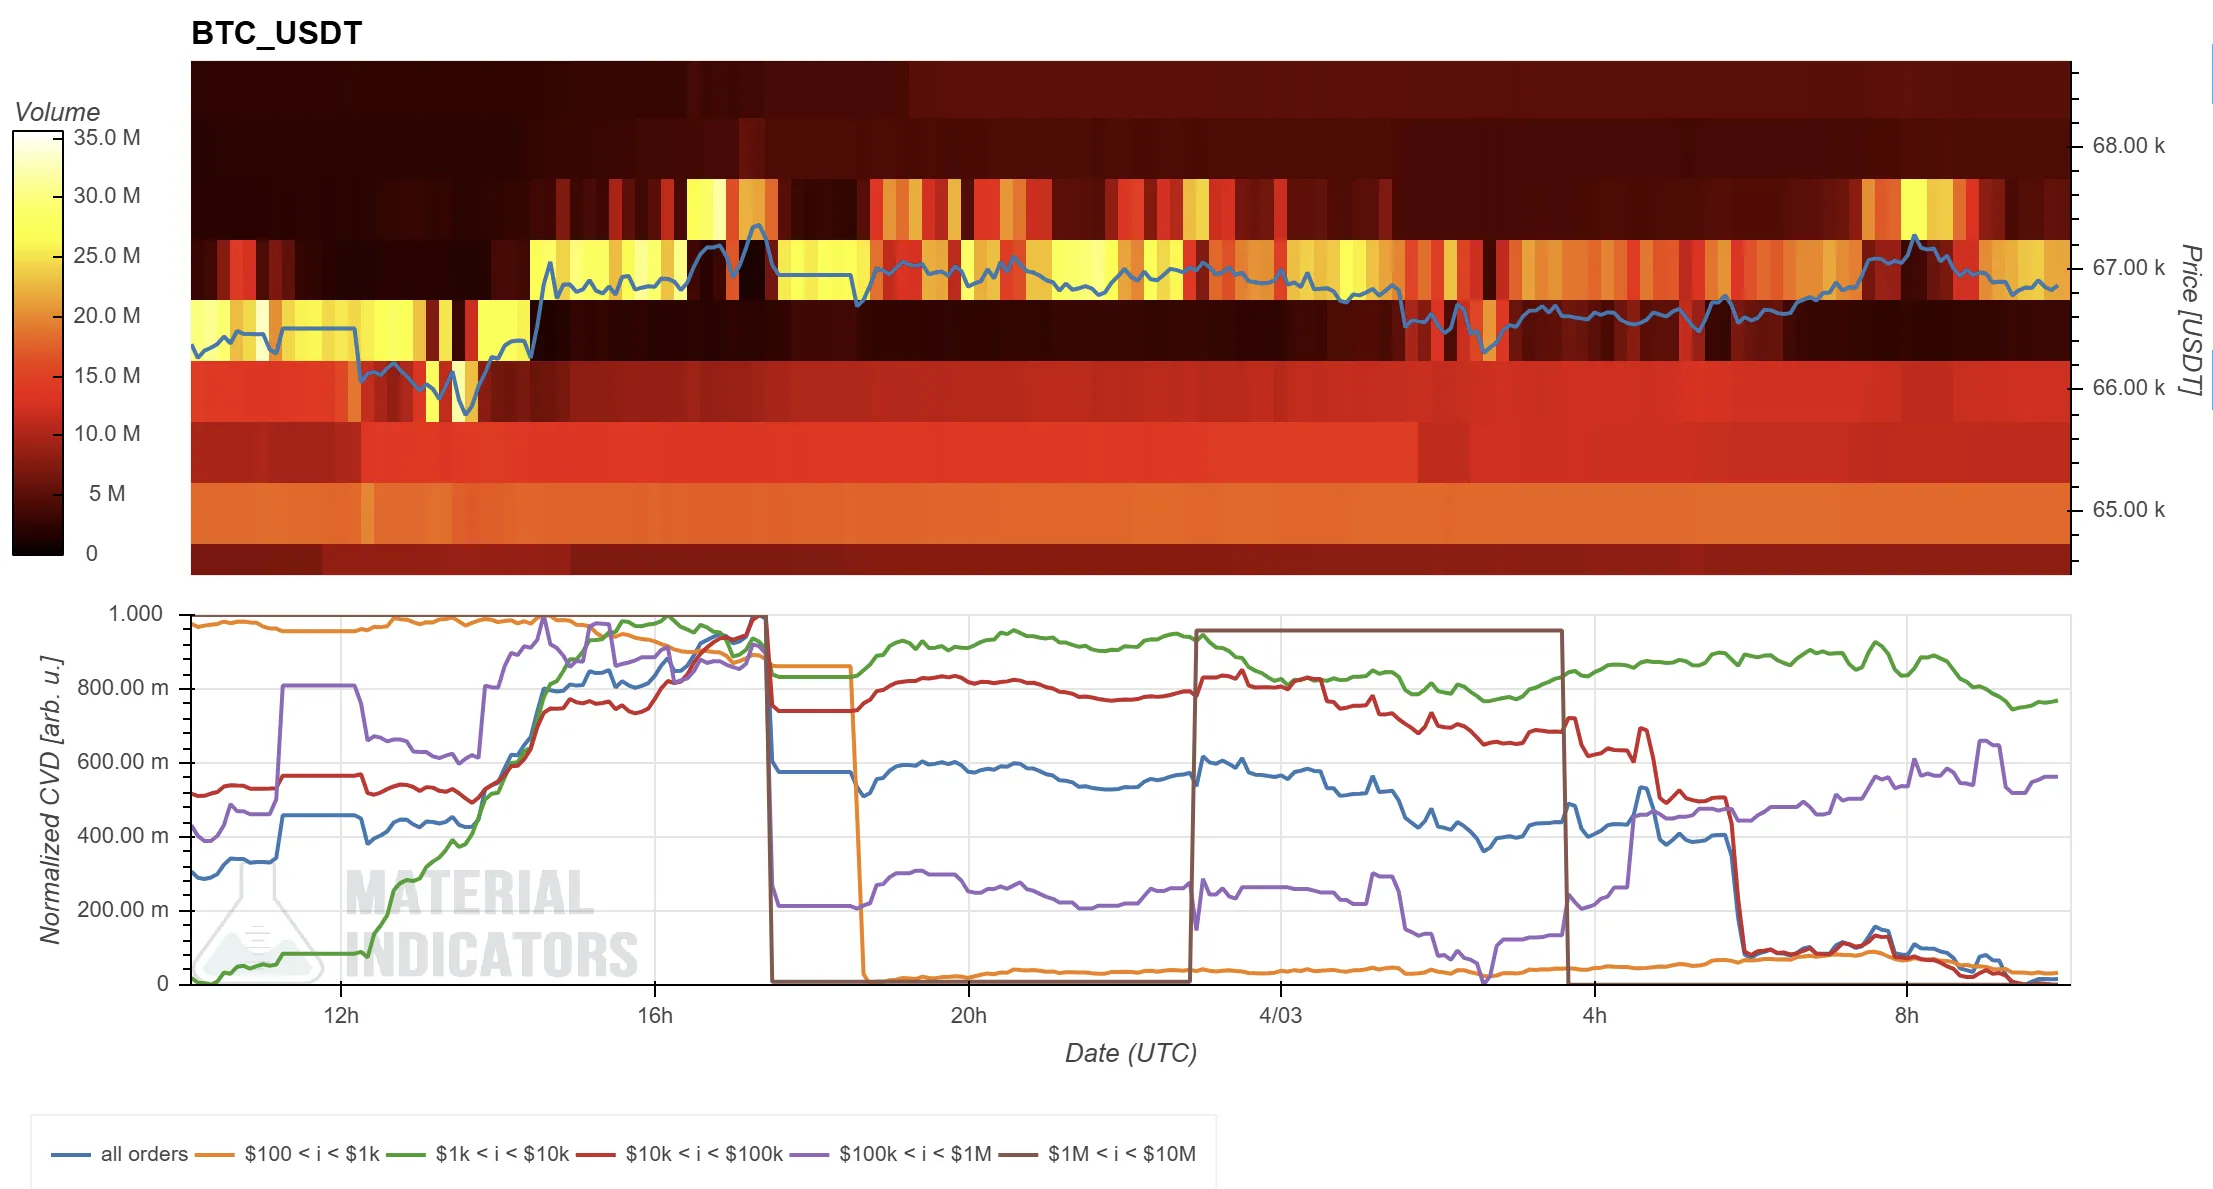 The following is an analysis of the spot Cumulative Volume Delta (CVD) chart for the BTC/USDT trading pair. The chart shows a Volume Heatmap on top and the CVD indicator at the bottom.
- The Volume Heatmap tracks trading volume at specific price levels. The background color brightens when the price consolidates in a particular range or experiences a significant move. These brighter areas can potentially act as support or resistance levels.
- The CVD indicator represents buy and sell orders categorized by trade size. A rising line indicates an increase in buy orders for that category. For example, the yellow line tracks orders between $100 and $1,000, while the brown line represents large orders ranging from $1 million to $10 million.
The following is an analysis of the spot Cumulative Volume Delta (CVD) chart for the BTC/USDT trading pair. The chart shows a Volume Heatmap on top and the CVD indicator at the bottom.
- The Volume Heatmap tracks trading volume at specific price levels. The background color brightens when the price consolidates in a particular range or experiences a significant move. These brighter areas can potentially act as support or resistance levels.
- The CVD indicator represents buy and sell orders categorized by trade size. A rising line indicates an increase in buy orders for that category. For example, the yellow line tracks orders between $100 and $1,000, while the brown line represents large orders ranging from $1 million to $10 million.Log in to leave comments!
Share insights, connect ideas
Log In