BTC/USDT spot CVD chart at 4 p.m. UTC, Apr. 21
April 22, 2026, 12:05 AM
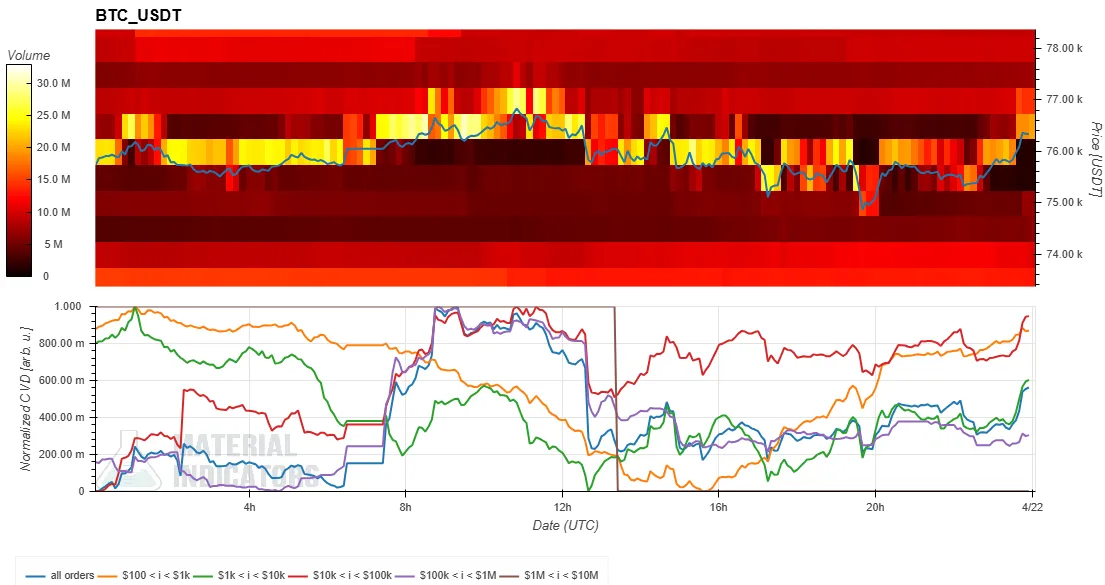 The spot Cumulative Volume Delta (CVD) chart analyzes the order book for the BTC/USDT spot trading pair. The upper portion shows a volume heatmap, while the lower portion displays the CVD.
- The volume heatmap at the top tracks trading volume at specific price levels. The background color brightens when the price lingers in a range or makes a significant move. These brighter areas can potentially act as support or resistance.
- The CVD indicator at the bottom shows buy and sell orders categorized by size. A line rises as buy orders in its category increase. For example, the yellow line represents orders between $100 and $1,000, while the brown line tracks large orders between $1 million and $10 million.
The spot Cumulative Volume Delta (CVD) chart analyzes the order book for the BTC/USDT spot trading pair. The upper portion shows a volume heatmap, while the lower portion displays the CVD.
- The volume heatmap at the top tracks trading volume at specific price levels. The background color brightens when the price lingers in a range or makes a significant move. These brighter areas can potentially act as support or resistance.
- The CVD indicator at the bottom shows buy and sell orders categorized by size. A line rises as buy orders in its category increase. For example, the yellow line represents orders between $100 and $1,000, while the brown line tracks large orders between $1 million and $10 million.Log in to leave comments!
Share insights, connect ideas
Log In