BTC spot CVD chart for 6:00 a.m. UTC on May 28
May 28, 2026, 6:01 AM
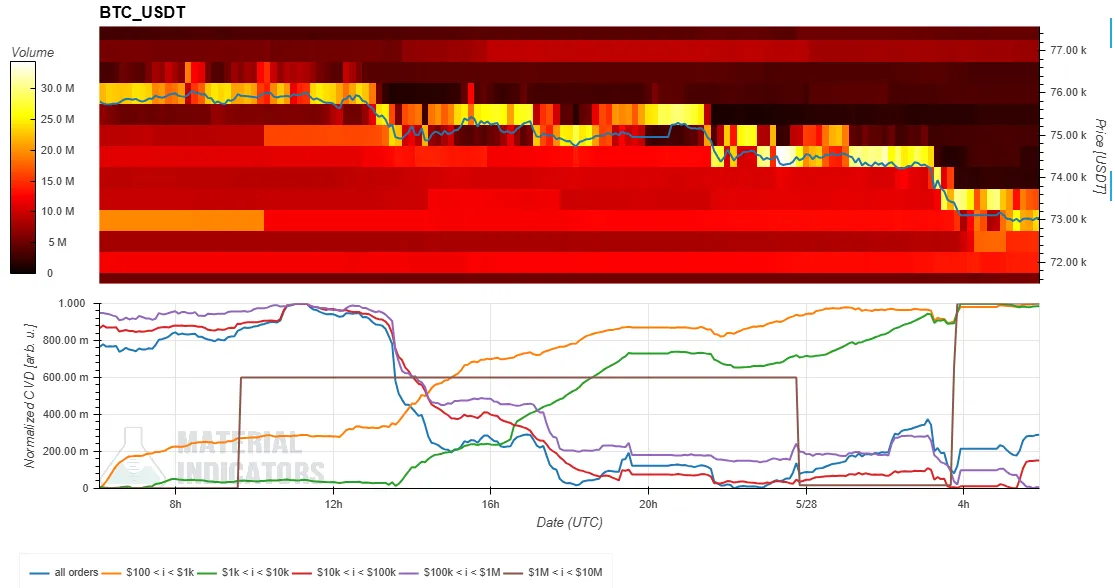 The following is a spot Cumulative Volume Delta (CVD) chart analyzing the order book for the BTC/USDT spot pair. The top section shows the Volume Heatmap, while the bottom displays the CVD.
- Volume Heatmap (Top): This tracks the volume of trades at specific price levels. The background color brightens when the price remains in a certain range for an extended period or moves significantly. These brighter areas can indicate potential support and resistance levels.
- Cumulative Volume Delta (CVD) (Bottom): This indicator represents buy and sell orders categorized by trade size. As buy orders for a given category increase, the corresponding colored line rises.
- Yellow line: Orders between $100 and $1,000
- Brown line: Large orders between $1 million and $10 million
The following is a spot Cumulative Volume Delta (CVD) chart analyzing the order book for the BTC/USDT spot pair. The top section shows the Volume Heatmap, while the bottom displays the CVD.
- Volume Heatmap (Top): This tracks the volume of trades at specific price levels. The background color brightens when the price remains in a certain range for an extended period or moves significantly. These brighter areas can indicate potential support and resistance levels.
- Cumulative Volume Delta (CVD) (Bottom): This indicator represents buy and sell orders categorized by trade size. As buy orders for a given category increase, the corresponding colored line rises.
- Yellow line: Orders between $100 and $1,000
- Brown line: Large orders between $1 million and $10 millionLeave the first comment
You need to log in to leave a comment.
Log In