BTC spot CVD chart as of 10:00 a.m. UTC on Aug. 25
August 25, 2026, 9:58 AM
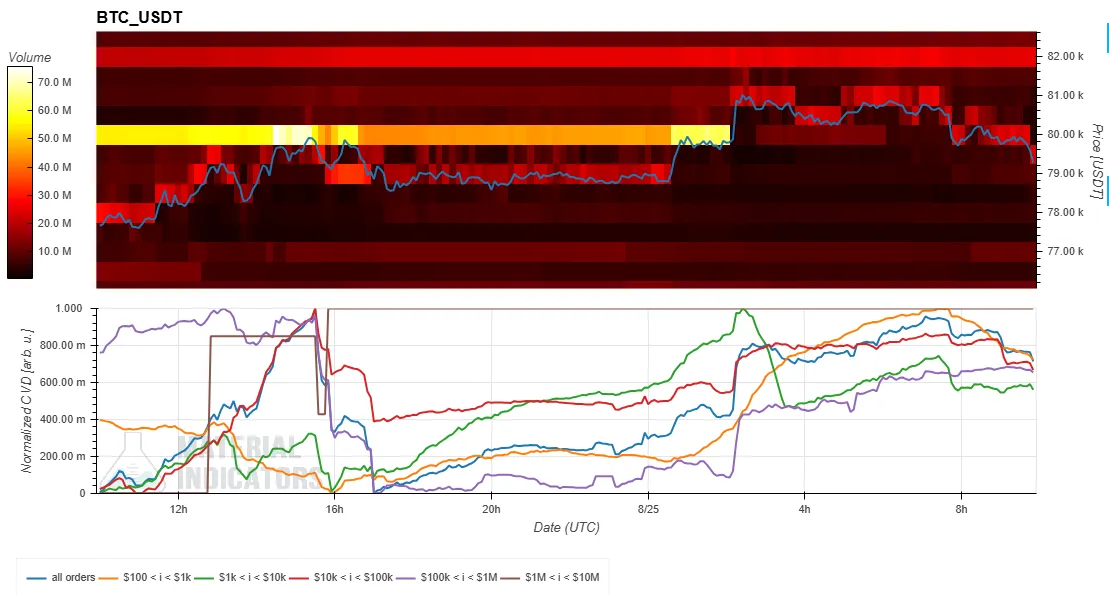 Spot CVD is an order-book analysis chart for the BTC/USDT spot trading pair. The upper panel shows the volume heatmap, while the lower panel shows cumulative volume delta, or CVD.
- The volume heatmap in the upper panel tracks trading volume by price range. The background color becomes brighter when the price stays in a specific range for an extended period or moves sharply. Brighter areas may act as support or resistance levels.
- The CVD indicator in the lower panel reflects buy and sell orders by capital size, and the line for each color rises as buying orders increase. The yellow line represents orders between $100 and $1,000, while the brown line represents large orders between $1 million and $10 million, among other categories.
Spot CVD is an order-book analysis chart for the BTC/USDT spot trading pair. The upper panel shows the volume heatmap, while the lower panel shows cumulative volume delta, or CVD.
- The volume heatmap in the upper panel tracks trading volume by price range. The background color becomes brighter when the price stays in a specific range for an extended period or moves sharply. Brighter areas may act as support or resistance levels.
- The CVD indicator in the lower panel reflects buy and sell orders by capital size, and the line for each color rises as buying orders increase. The yellow line represents orders between $100 and $1,000, while the brown line represents large orders between $1 million and $10 million, among other categories.Leave the first comment
You need to log in to leave a comment.
Log In